
Feline SAA Detection ELISA Assay Kit

- SKU:
- 445-6028
- Size:
- 1 kit
- Shipping:
- Gel Packs
- Storage:
- -20 C

Description
Feline SAA Detection ELISA Assay Kit - Cat Number: 6028 From Chondrex.
Research Field: Inflammation
Clonality: N/A
Cross-Reactivity:
Host Origin: N/A
Applications: N/A
Isotype: N/A
Detection Range: 2000 ng/ml-31 ng/ml
Sample Type: Liquid Samples
Concentration: N/A
Immunogen:
PRODUCT SPECIFICATIONS
DESCRIPTION: Assay kit to quantify feline SAA proteins
FORMAT: Pre-coated 96-well ELISA Plate with removeable strips
ASSAY TYPE: Sandwich ELISA
ASSAY TIME: 4 hours
STANDARD RANGE: 2000 ng/ml to 31 ng/ml
NUMBER OF SAMPLES: Up to 40 (duplicate) samples/plate
SAMPLE TYPES: Serum and Plasma
RECOMMENDED SAMPLE DILUTIONS: 1:1 (at least)
CHROMOGEN: TMB (read at 450 nm)
INTRODUCTION
Acute phase proteins (APPs) are blood proteins that are an integral part of acute phase responses (APR). The APR is a part of the innate
host defense system which is triggered by tissue damage and inflammation caused by infectious, immunologic, or neoplastic agents. One of
the well-characterized APPs, serum amyloid A (SAA) is a 11.4 - 12.5 kDa protein consisting of 104 - 112 amino acids in different species.
The protein is well-conserved in the evolution of eutherian mammals, indicating an important role in biological functions. The N-terminus of
the molecule is hydrophobic and probably responsible for its lipid-binding properties which allows SAA to form complexes with high-density
lipoproteins as well as apoproteins (1). In inflamed tissues, macrophages serve as a major source of SAA.
In fact, during APR, SAA levels in plasma increase 1000-fold in human and other species, suggesting it may be an important indicator of
disease status. Elevated SAA levels are also seen in rheumatoid arthritis, atherosclerosis, Crohn’s disease, and Type 2 diabetes. These
findings suggest that SAA may play an active and/or a protective role in inflammatory disorders (2, 3).
In veterinary medicine, Tamamoto et.al. indicated that measuring feline SAA concentration, in addition to white blood cell counts, would be
clinically valuable as a routine test to detect inflammation (4). Furthermore, SAA levels work as a significant and independent prognostic
marker in cats with various diseases such as neoplastic diseases and inflammatory diseases (5).
Chondrex, Inc provides a Feline Serum SAA Detection ELISA Kit (Cat # 6028) which can be used to detect and monitor feline inflammation,
as well as in studies investigating inflammation. Please contact Chondrex, Inc. at support@chondrex.com for more information.
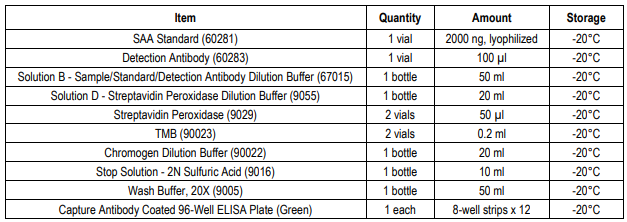
KIT COMPONENTS
ASSAY OUTLINE
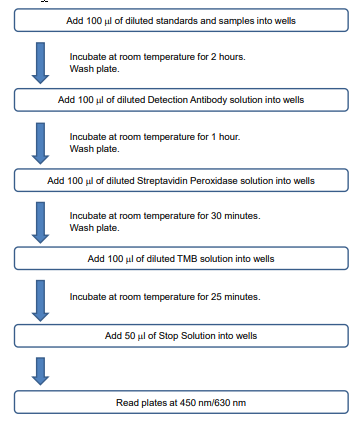
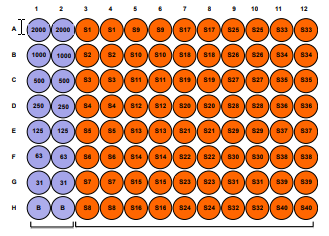
PLATE LAYOUT
NOTES BEFORE USING ASSAY
NOTE 1: It is recommended that the standard and samples be run in duplicate.
NOTE 2: Warm up all buffers to room temperature before use.
NOTE 3: Crystals may form in Wash Buffer, 20X when stored at cold temperatures. If crystals have formed, warm the wash buffer by placing
the bottle in warm water until crystals are completely dissolved.
NOTE 4: Measure exact volume of buffers using a serological pipet, as extra buffer is provided.
NOTE 5: Cover the plate with plastic wrap or a plate sealer after each step to prevent evaporation from the outside wells of the plate.
NOTE 6: For partial reagent use, please see the assay protocol’s corresponding step for the appropriate dilution ratio. For example, if the
protocol dilutes 50 µl of a stock solution in 10 ml of buffer for 12 strips, then for 6 strips, dilute 25 µl of the stock solution in 5 ml of buffer.
Partially used stock reagents may be kept in their original vials and stored at -20⁰C for use in a future assay.
NOTE 7: This kit contains animal components from non-infectious animals and should be treated as potential biohazards in use and for
disposal.
IN VITRO PROTOCOL: A protocol for in vitro studies will vary due to the types of cultured cells, culture systems, purpose
of study, etc. Please contact support@chondrex.com for more information about optimization.
PREPARING STANDARDS: A standard range of 12.5 to 0.2 μg/ml is recommended. To prepare standard dilutions, use a
diluent with the same ratio of normal mouse plasma to PBS as the samples. For example, if
using a 1:2 dilution for sample dilution (in vivo protocol, Step 4), prepare 33% normal mouse
plasma in 0.05M phosphate buffered saline (300 μl plasma with 600 μl PBS) as a diluent.
1. 10 μl of 25 mg/ml FITC-Dextran with 990 μl of PBS (250 μg/ml).
2. 12.5 μl of the diluted FITC-Dextran with 237.5 μl of 33% normal mouse plasma in 0.05M
phosphate buffered saline (12.5 μg/ml).
3. Mix 125 μl of the 12.5 μg/ml solution with an equal volume of 33% mouse normal plasma
(6.3 μg/ml).
4. Repeat 5 times for the 3.1, 1.6, 0.8, 0.4, and 0.2 μg/ml standard solutions.
5. Transfer 50 or 100 μl of diluted standards and samples to a black 96-well plate and read
on a fluorescence reader.
6. Subtract the FI blank values (33% normal mouse plasma in 0.05M phosphate buffered
saline) from the FI values of the standards and samples.
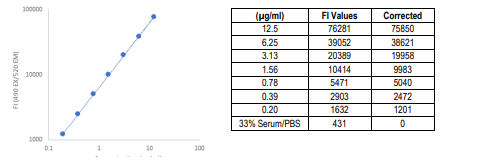
7. Plot the FI values of the standards against the μg/ml of the FITC-Dextran standards. Using
a log/log plot will linearize the data (Figure 1).
Figure 1. A Typical Standard Curve for FITC-Dextran
STORAGE: -20°C
VALIDATION DATA: Intra-Assay (5.7-8.1%)/Inter-Assay (5.1-9.6%)/Spiking Test (104-109%)
NOTES:
Related Products
Related Products

Mouse CXCL14 Detection Assay Kit

Human CCL28 Detection Assay Kit

Human CXCL14 Detection Assay Kit

Mouse CCL17 Detection Assay Kit
