
Rat Urinary Protein Assay Kit

- SKU:
- 445-9040
- Size:
- 1 kit
- Shipping:
- Gel Packs
- Storage:
- RT

Description
Rat Urinary Protein Assay Kit - Cat Number: 9040 From Chondrex.
Research Field: Arthritis, ECM
Clonality: N/A
Cross-Reactivity:
Host Origin: N/A
Applications: N/A
Isotype: N/A
Detection Range: 4 mg/ml-0.4 mg/ml
Sample Type: Urine
Concentration: N/A
Immunogen:
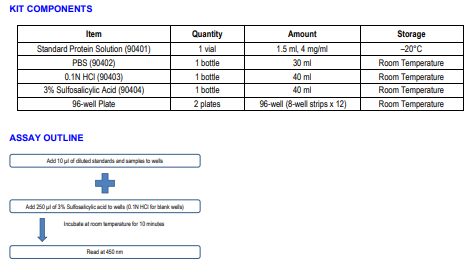
PRODUCT SPECIFICATIONS
DESCRIPTION: Assay kit to evaluate urinary protein concentration
FORMAT: 96-well ELISA Plate with removeable strips
ASSAY TYPE: Turbidity Assay
ASSAY TIME: 10 minutes
STANDARD RANGE: 4 mg/ml to 0.4 mg/ml
NUMBER OF SAMPLES: Up to 16 (duplicate) samples/plate
SAMPLE TYPES: Urine
RECOMMENDED SAMPLE DILUTIONS: 1:2 (at least)
CHROMOGEN: N/A (read at 450 nm)
STORAGE: -20°C for 12 months
VALIDATION DATA: N/A
INTRODUCTION
The turbidity assay method (1) has been widely used to determine urinary protein levels in human specimens because it is accurate, easy, and economical. However, urine volume collected from rats varies from 0.1 ml to 20 ml during a 16-hour collection period, thus the volume is occasionally insufficient for current assay methods. In addition, turbidity (OD 450 nm) readings of individual test tubes using a spectrophotometer may be cumbersome. Chondrex, Inc.’s Rat Urinary Protein Assay Kit (Cat # 9040) uses the turbidity method in 96-well plates, offering a solution for assaying a large number of rat urine samples.
Protein concentrations in urine samples can be determined by turbidity or Bradford assay methods (2). The turbidity assay method which utilizes 3% sulfosalicylic acid is more convenient than the Bradford assay method for assaying a large number of samples because of the wide range of the dose response curve (Ex: 0.4 to 4 mg/ml) and the stable turbidity. Regardless of the assay method used, bovine serum albumin (BSA) cannot be used as a standard.
For example, in the turbidity assay, the dose response curve generated by BSA significantly differs from that of serum proteins. In the Bradford assay, OD value of globulins is only 70% that of BSA (3). Therefore, a standard protein solution prepared from normal rat serum is ideal for assaying urinary protein levels instead of using BSA.
NOTE: The Bradford assay method requires two separate regression curves for assaying protein concentration, from 0.05 to 0.6 mg/ml and from 0.5 to 1.5 mg/ml. Because the protein concentration in rat urine can vary from 0.1 mg/ml to 50 mg/ml depending upon the progress of nephritis, various dilutions of individual samples are required.
URINE COLLECTION PROTOCOL
Collect urine from 5 pm to 9 am every other day with metabolic cages. Measure the urine volume and centrifuge to remove insoluble materials.
Keep the supernatant in a refrigerator for short-term storage and at –20°C for long-term storage.
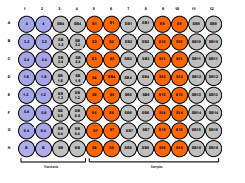
PLATE LAYOUT
The assay should be performed in duplicate for both standards and samples. Because urine samples and even the standard may be colored due to hemoglobin contamination, it is important to determine the individual background values and subtract them from the turbidity values in sample wells. Therefore, columns 3-4, 7-8, and 11-12 are used as blank wells
NOTES BEFORE USING ASSAY
NOTE 1: It is recommended that the standard and samples be run in duplicate.
NOTE 2: This kit contains animal components from non-infectious animals and should be treated as potential biohazards in use and for
disposal.
CALCULATING RESULTS
1. Average the duplicate OD values for the blank, standards, test samples, and sample blanks.
2. Subtract the averaged blank OD value from the individual averaged standard, standard blank, sample, and sample blank OD values.
Subtract the averaged standard blank and sample blank OD values from their corresponding averaged standard and test sample OD
values.
3. Plot the adjusted OD values of the standards against the concentration (mg/ml) of standard protein. Figure 1 shows representative OD
values of the standard range from 0.4 - 4 mg/ml.
4. The protein levels in samples can be calculated using regression analysis. If necessary, multiply it by the sample dilution factor to
obtain the urinary protein concentration in the original sample. For additional assistance, please download a sample calculation worksheet from www.chondrex.com. Copy the raw data into the template’s cells C9-N16, redo the trendline and display the new trendline equation. Then type the “a” and “b” values from the equation of the standard regression curve into cells M38 and M39 respectively. Type in the volumes used for the samples (cells D60-D75) and PBS (cells E60-E75) to calculate sample dilution. The protein concentration in urine will be displayed in the last column (cells N60-N75).
Determining the total amount of protein secreted in urine is preferred over the urinary protein concentration alone because the protein concentration is generally high when urine volume is small. Chondrex, Inc. recommends determining the total amount of protein secreted in urine in 16- or 24-hour periods to determine renal function.
Total urinary protein (mg) = concentration (mg/ml) x volume of urine (ml)
Related Products
Related Products

Rat Urinary Protein Assay Standard
 Assay Kit")
Rat Urinary (NAG) Assay Kit | 80390
 Assay Kit-Positive Control")
Rat Urinary (NAG) Assay Kit-Positive Control | 80393
 Assay Kit")
Rat Glycated Serum Proteins (GSP) Assay Kit | 80430
 Assay Kit")