
Rabbit Anti S-AdenosylMethionine (SAM) | PA00201

- SKU:
- ART-PA00201
- Availability:
- Usually Shipped in 5 Working Days
- Size:
- 100 µg

Description
Rabbit Anti S-AdenosylMethionine (SAM) | PA00201 | Arthus Biosystems
Product name
Rabbit anti—SAM a/b
Catalog Number
PA00201-50/100
Description
Rabbit polyclonal antibody to S- Adenosylmethionine [R3]
Specificity
Dosage-dependent competition was detected as a sample was added to a cELISA (Any SAM from a sample competes with the coated SAM heptan to bind anti-SAM polyclonal antibody R3). The sample is the product of the following biochemical reaction: Methionine Adenosyltransferase (MAT) was added to methionine and adenosine triphosphate under an appropriate buffer at 37°C. It indicates that antibody R3 specifically binds physiologically produced SAM.
Cross Reaction
PA00201 shows the following reactivity with related compounds: S-Adenosylmethionine: 100%, S-Adenosylhomocysteine: < 1%, Adenosine: < 1%, L-Methionine: < 1%, Methythioadenosine (MTA): —3.5%, ADP (adenosine diphosphate): < 1%, ATP (adenosine triphosphate): < 1%
Immunogen
S- Adenosylmethionine analog conjugated to KLH
Properties
Form
Liquid
Storage instructions
Store at 4°C, -20°C for long term storage
Storage buffer
PBS 10mM pH7.4 (NaCI 150mM), Sodium azide 0.02%, BSA 10mg/m1 or PBS 10mM, pH7.4 (NaCI 150mM), Sodium azide 0.02%, Glycerol 50%, BSA 10mg/m1
Purity
>95% Purified from mouse ascites fluid by affinity chromatography
Clonality
Rabbit polyclonal
Clone number
R3
Immunoglobin isotype
Polyclonal
Affinity
Ka = 9.58 x 10⁸L/mol (1.04 x 10 9M)
Research Areas
- Methylation of biomolecules (DNA, RNA, proteins, hormones, neurotransmitters, etc.)
- One-carbon metabolism
- Signal Transduction
- Metabolism
- Pathways and Processes Cancers
- Arthritis
- Heart diseases
- Neurodegenerative diseases
- Atherosclerosis
- Liver diseases
- Kidney diseases
Applications
The use of PA00201 in the following tested applications has been tested. The application notes include recommended starting dilutions.Optimal dilutions/concentrations should be determined by the end user.Higher dilution than suggested maybe used in IHC and IF.The product may be used in other not-yet-tested applications.
Notes
- cELISA: 1:2000-3000
- FCM: 1:20-40
- IHC: 1:20-40
Target
S- Adenosylmethionine is a common co-substrate involved in methyl group transfers. It is made from adenosine triphosphate (ATP) and methionine by methionine adenosyltransferase.Transmethylation, transsulfuration, and aminopropylation are the metabolic pathways that use SAM.Although these anabolic reactions occur throughout the body, most SAM is produced and consumed in the liver.
Cellular localization
Cytoplasm, nuclear
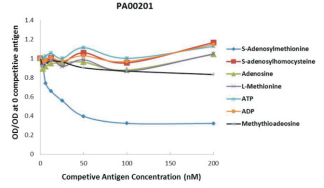
Figure 1: Competitive ELISA with anti-S-Adenosymethionine polyclonal antibody [R3] (PA00201)
The 0.1 pg/ml of SAM coating standard (Cat # ACT00201) was coated into 96 wells. Serial dilution of SAM standard (Cat# AST00201), S- Adenosylhomocysteine (SAH), Adenosine (Ade), L-Methionine (Met), Methythioadenosine (MTA), Adenosine diphosphate (ADP), Adenosine triphosphate (ATP) and properly diluted rabbit anti-SAM serum was added. HRP conjugated Goat anti-Rabbit IgG antibody was used and TMM to develop the color.
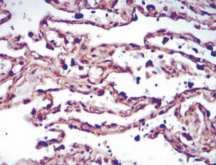
Figure 2: Immunohistochemistry staining performed using PA00201 (1:20) with benign lung tissue adjacent to carcinoma.Brown areas indicated strong positive staining in cytoplasm and nuclei (X400).
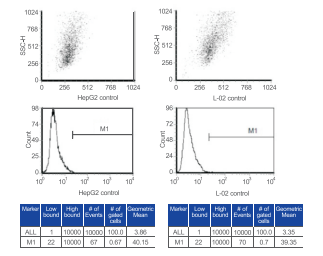
Figure 3: FCM analysis control.Normal liver cells L02 and carcinoma cells Hep G2 were stained with the buffer without any antibody.
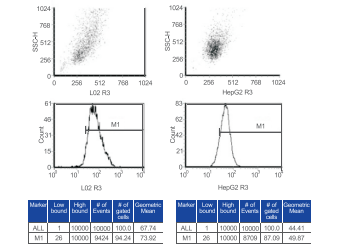
Figure 5: FCM results from normal liver cell line L02 and hepatocyte carcinoma cell line Hep G2 stained with anti-SAM polyclonal antibody R3.Average fluorescence signal in Hep G2 cells was reduced compared to that in L02 cells, indicating SAM level is reduced during carcinogenesis.
Related Products
Related Products

Mouse Anti S-AdenosylMethionine (SAM) Clone 118-6 | MA00201

Mouse Anti S-AdenosylMethionine (SAM) Clone 84-3 | MA00202

Biotin S-AdenosylMethionine (SAM) | ACT00202

Mouse Anti S-AdenosylMethionine (SAM) Clone 84-19 | MA00204-50
